


dxFeed Market Data: Why a Trade Can Add Volume Without Moving the Chart
A stock trades at $50.40. A brokerage customer sees the print in the transaction list, but the high on the one-minute chart stays at $50.10. Which number should the support desk defend? For a broker using dxFeed, the answer can be both. A US equity trade can count towards volume while its sale condition keeps its price out of the high. The customer has spotted a difference between two records that describe the same market.
dxFeed supplies streaming and historical financial market data to businesses including online brokers and financial websites. Its API gives developers a choice of records for each display. That choice matters because a quote tile, a scrolling tape and a chart each promise the reader something different about the number on screen.
Three prints in one minute
Consider a hypothetical minute in a US-listed stock. Assume the desk is looking at one consolidated feed, in the regular session, with no other activity. First, 100 shares trade at $50.00. Then ten shares trade at $50.40. Finally, another 100 trade at $50.10. The first and third prints qualify to update the high, low and last. In this example the feed marks the middle print with the odd-lot sale condition, I. The condition actually carried on the record matters more than a guess based on its size.
In dxFeed’s mapping for the NYSE and NYSE American consolidated tape, that odd-lot condition qualifies for volume but does not update the consolidated last or high and low. Under those assumptions, the three reports account for 210 shares. The eligible price range runs from $50.00 to $50.10. Sorting all three prices and taking the largest would produce a chart high of $50.40. Dropping the middle row entirely would leave only 200 shares. Each shortcut gets a different part of the minute wrong.
This distinction affects the design of a brokerage screen. A user who selects all prints has a reason to see the ten-share trade. A user inspecting the candle has a reason to see $50.10. Showing the sale condition next to the print lets the desk explain both figures without hiding a transaction or redrawing the bar. The same letter should be interpreted using the rules for its feed. The effect of a condition on a US equity tape cannot simply be carried over to an options or futures feed.
A snapshot cannot reconstruct a cancelled trade
dxFeed’s Trade event gives an application the latest trade state for an instrument. Its TimeAndSale stream supplies identifiable events, including subsequent changes to earlier reports. This is a practical distinction for anyone building a trade list. Sampling a last-price tile every second may capture the most recent state accurately each time, while still losing several trades that arrived between samples.
Now consider a separate example. Two ordinary, eligible trades are reported at $31.00 and $31.20, in that order. The exchange then cancels the second one before another trade occurs. In the behaviour documented by dxFeed, a TimeAndSale cancellation refers back to the affected event. The last price returns to $31.00. On the tile that can look like a fresh trade at the lower price. On the tape it is a cancellation of the $31.20 report. Appending another $31.00 trade would invent both a transaction and its volume. A replay that retains the event index can show precisely which report changed.
What a support desk can compare
The Time and Sales panel in dxFeed Viewer gives a desk a way to narrow down a discrepancy. Select the instrument, check the data endpoint and compare the view showing all ticks with the filtered view. Millisecond timestamps and the sale condition help identify the print in question. The viewer is a diagnostic tool. Its guide also explains that enabling two endpoints for the same instrument can interleave their updates, so the choice of endpoint belongs in any record of a comparison.
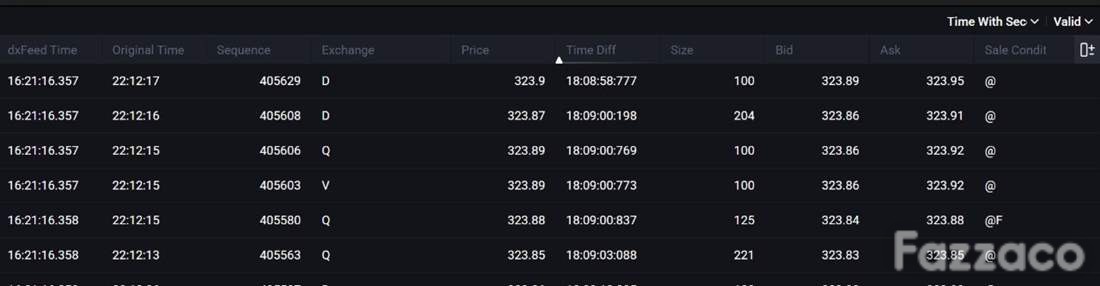
The Time and Sales panel shown in the dxFeed Viewer guide. The figures are from the vendor’s illustration.
Even with the same symbol, the comparison period can change the answer. dxFeed distinguishes an exchange-session daily candle from a fixed 24-hour candle built on UTC boundaries. For an overnight session, those cuts can put a trade on different sides of the day boundary. And for Forex symbols, dxFeed directs developers to the Quote event for bid and ask prices. A line derived from their midpoint describes quoted prices. A customer asking about a particular fill still needs the broker’s own order and execution record, with its timestamp and execution price.
 Subscribe Now