


TradingView Adds Two New Volume Delta indicators

TradingView, the all-things trading platform for traders and the global leader in charting and analysis tools, has added two new volume-based indicators, Volume Delta and Cumulative Volume Delta. These indicators use intrabar volume and price fluctuations to estimate the difference (delta) between buying and selling pressure within each chart bar, providing insight into an instrument's sentiment and market dynamics.
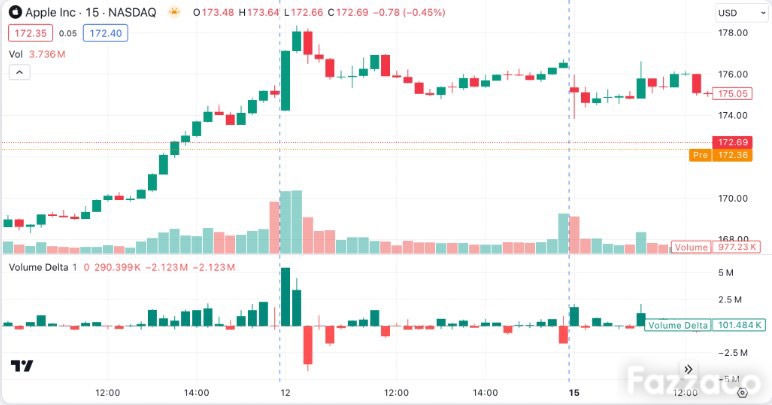
The regular Volume Delta indicator analyzes each chart bar from an intrabar timeframe (i.e., a timeframe lower than the chart's), categorizing each intrabar's volume as positive or negative. It gradually accumulates the polarized volume values throughout a chart bar to calculate the volume delta, and it keeps track of the highest and lowest volume delta values accumulated over the bar's duration. The resulting values are displayed as a candle: the open is always 0, the candle's close indicates the final delta volume, and high and low are respectively the highest and lowest volume delta for the current bar.
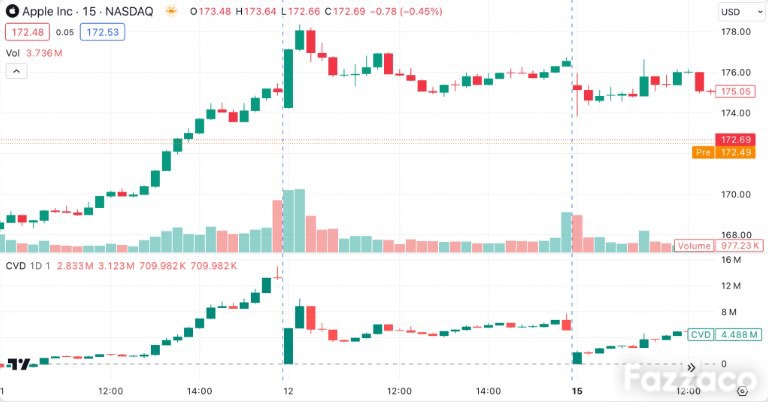
The Cumulative Volume Delta indicator is based upon a similar principle, but with an added benefit: it accumulates volume delta across a period to provide a broader perspective. Each new bar's volume delta adds to the cumulative value calculated on the previous bar. The only exception is when a new period starts, which resets the cumulative calculation. So the open of every new volume candle that does not signify the start of a new period is equal to the close of the previous one, and HLC values of that candle are built upon its open.
This latest addition follows the recent introduction of two new analysis tools, Volume Candles and Time Price Opportunities (TPO), earlier this month, marking a further expansion of the charting platform's capabilities.
 Subscribe Now